Monetary Policies and contrasting signals from economic data
1. EDITORIAL
Good morning to all of our readers.
January saw an intense sell-off on almost all the asset classes seen as risky on the markets (the only exceptions were High Yield bonds and gold, the latter seen once again as the safe haven it used to be).
This turbulence on the markets started with the oil rout from the last summer; this rout had been induced before from a supply side shock, and then a sort of contagion on the demand side on the oil itself and on the commodities markets as a whole.
Markets will fear a recession as the weight of the oil sector and the commodities corporation weighs too much on the developed countries economies, and also the lack of flexibility of the Central Banking systems of this economies.
Macroeconomic data are contrasting and do not show a clear pattern ahead; the actual scenario is well different from the one experimented in the 2008, where the economies faced a liquidity crisis.
Policy Makers are trying to act to help improve economic fundamentals; for example the Bank of Japan cut the rates and brought them into negative territory. The same path may be followed by the ECB next month and the FED could postpone further rate hikes until next year.
We will try to help you navigate the markets and keep you posted with updates and to advice you the best investment decisions.
Gianluigi Montagner
2. MONETARY POLICIES AND CONTRASTING SIGNALS FROM ECONOMIC DATA
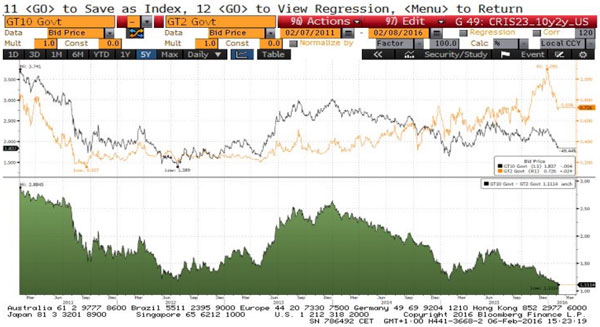
There are a lot of predictors that financial operators look at while trying to navigate the markets. One of the best predictors of future pain for equity markets is the shape of the US yield. A flat or downward sloping US yield curve has traditionally been in place before a major recession, EPS (Earnings per Share) collapse and a global bear market. It is telling us that Fed policy is tight and likely to drive a slowdown in the economy.
The Figure 1 below shows us the shape of the yield curve (USD 10-year minus 2-year treasuries) over time. This was around zero before the 2000-03 and 2007-09 bear markets began. It is reassuring that, even with the recent Fed hike and rally in treasuries, the US yield curve is still upward sloping.
Someone could argue that using the yield curve to predict future economic and stock market performance is less applicable in an age of QE and ultra-low rates, but its decent predictive record makes the financial operators feel that it would be wrong to leave it out.
Yield curves are even upward sloping in Europe, for example if you look at the EUR curve you will face a 10-year Bund yield that is very low, maybe too much low, and the 2-year Schätze yields sunk more than -0.5% (movement that started on August 2014) for the first time the last 3rd February.
What are the countermeasures that the policy makers could put in place to prevent another global rout? Once again we are facing, as shown briefly in our first newsletter, a world in which divergence on politics is the new key fact.
Divergence between major central banks was the news of the past week, as the Bank of Japan (BoJ) surprised markets with more easing pushing the rates in negative territories, the Bank of England (BOE) held steady and the speech of Carney was still dovish and European Central Bank (ECB) officials discussed their comfort with additional easing measures if it was required.
Interestingly, in the US, the financial condition tightening over the past weeks was noted by NY Federal Reserve (Fed) President William Dudley, who was quoted as saying that conditions were “considerably tighter” than at the time of the December Fed meeting. US markets reacted negatively to a weaker-than-expected reading on the service sector of the economy, which had been seen as a driver of growth. This was emblematic of the global growth concerns that, along with oil price volatility, will continue to put pressure on markets.
Global equities fell, with the EuroStoxx, Financial Times Stock Exchange (FTSE), Nikkei, Hang Seng, S&P 500 and Bovespa, falling respectively -5.35%, -3.57%, -2.71%, -2.54%, -1.44% and -0.55%. Data this week will show the Euro-area economy grew only 0.3 percent in the fourth quarter, the same pace as the previous three months, according to the median forecasts of analysts interviewed in a Bloomberg survey. Take into account that the past week week the European Commission cut its prediction for 2016 growth in the 19-nation bloc.
Financial Operators have priced in a 10 basis-point cut to the ECB’s minus 0.3 percent deposit rate in March 2016, according to forward contracts based on the EONIA rate (Euro Overnight Index Average).
Some economists are also calling for an increase to the pace of the central bank’s asset-purchase program, which currently stands at 60 billion euros a month.
The options market is adding to signs that the gains in German securities may end. Investors are paying a higher premium to lock in prices to sell 10-year bund futures contracts than buy them. That came as the contract climbed to a record this week, encouraging some traders to take downside bets.
So all the eyes this year will be definitely pointed on the behaviour onbce again on the Central Banks and their actions to contrast the lack of growth. For example the last meeting of the FOMC (Federal Open Market Committee) gave a positive outlook on the macro data and scenarios but will keep an eye on their implications on the job markets and on the usual inflation, that is not taking pace upward as expected.
What strikes the most is the difference of views within the FOMC board irtself; the different members have absolutely contrasting ideas on the policies to be adopted. Someone is hawkish, George, someone is dovish, like Dudley and Brainard, and someone else, Fisher, doesn’t know clearly the direction that need to be taken.
So the next rate increases in the 2016 will be less certain than before and the main changes in the monetary policies should be moved further in the 2017 if the market data and conditions will keep been contrasted.
Cristian Rusconi
3. DATA TO WATCH
US
- 9th February: NFIB Small Business Optimism
- 9th February: Wholesale Inventories
- 10th February: MBA Mortgage Applications
- 10th February: US Crude Oil Inventories
- 16th February: Empire Manufacturing Index
- 16th February: NAHB Housing Market Index
- 17th February: MBA Mortgage Application
EU
- 9th February: Trade Balance & Industrial Production [GER]
- 10th February: Trade Balance & Industrial Production [FRA]
- 12th February: CPI MoM & YoY & GDP [GER]
- 12th February: Industrial Production MoM & YoY & GDP QoQ & YoY [EZ]
- 16th February: ZEW Survey Expectations [EZ] & ZEW Survey Current Situation & Expectations [GER]
- 19th February: Consumer Confidence [EZ]
- 22th February: Markit Manufacturing/Services/Composite PMI [EZ]
DISCLAIMER: The only purpose of this document is to provide information about the current markets. This newsletter is prepared for information purposes only and should not be interpreted as investment advice. It does not constitute an offer or invitation by Framont to any person to buy or sell any security or instrument or to participate in any transaction or trading activity. It does not want to solicit the subscription of financial products and services, which must only be done after reading and understanding the Prospectus and any other related information. Framont & Partners Management Ltd verified very carefully the information contained in this document, but it does not ensure that such information is complete and correct and is not responsible either about the use that third parties make of such information or about any los s or damage that may arise after that use. Information included in this newsletter is considered as current as at the date of publication , without regard to the date on which you may read or be provided with such information. We do not accept any liability arising from any inaccuracy or omission in the information on this website. Every investor should always read the Prospectus and any other available information before making an investment decision. Furthermore, the yield or other terminology used to indicate the return is not guaranteed and may go down as well as up. The performance figures quoted (if any) refer to the past and past performance is not a guarantee of future performance or a reliable guide to future performance. An investment product may be affected by changes in currency exchange rate movements thereby affecting your investment return therefrom. More details about Framont are available on the website www.framontmanagement.com.